SlideSpeak does not currently integrate charts and infographics into our presentations.
We know how important charts and graphs are for PowerPoint presentations. They’re very powerful tools for visual communication, allowing you to present complex data in a clear and concise manner.
Therefore we will be integrating them soon and this article will explain when we expect to launch the feature and why you should sign-up to our waiting list.
Current Capabilities
As you know, the SlideSpeak platform allows you to create engaging PowerPoint presentations from prompts and uploaded documents. Whether you need a presentation for a business meeting, academic purpose, or any other professional scenario, our AI tool simplifies the process, saving you time and effort.
What’s Coming Next: AI-Generated Charts and Graphs
Feature Overview:
- Automatic Chart Creation: Our AI will analyze your data and automatically generate charts and graphs that best represent your information.
- Multiple Chart Types: From bar charts to pie charts, line graphs to scatter plots, our tool will support a variety of chart types to suit different data visualization needs.
- Customization Options: You will have the ability to customize the appearance of the charts, including colors, labels, and data points, ensuring they fit seamlessly with your presentation style.
Why This Feature Matters
With this new feature, you will be able to:
- Enhance your presentations with professional-grade data visualizations.
- Save time by letting our AI handle the creation of charts and graphs.
- Improve audience understanding and engagement through effective data presentation.
Timeline and Roadmap
We understand the anticipation around this feature, and we want to keep you informed about our progress. Here’s a brief roadmap for the release:
- Development Phase: Currently, our team is in the penultimate stages of development, ensuring that the feature is robust and user-friendly.
- Testing Phase: Over the next two weeks, we will begin internal testing to iron out any bugs and ensure smooth functionality.
- Beta Release: In three weeks, we plan to release a beta version to a select group of users for real-world testing and feedback.
- Official Launch: Within the next four to five weeks, we anticipate the full public release of the AI-generated charts and graphs feature.
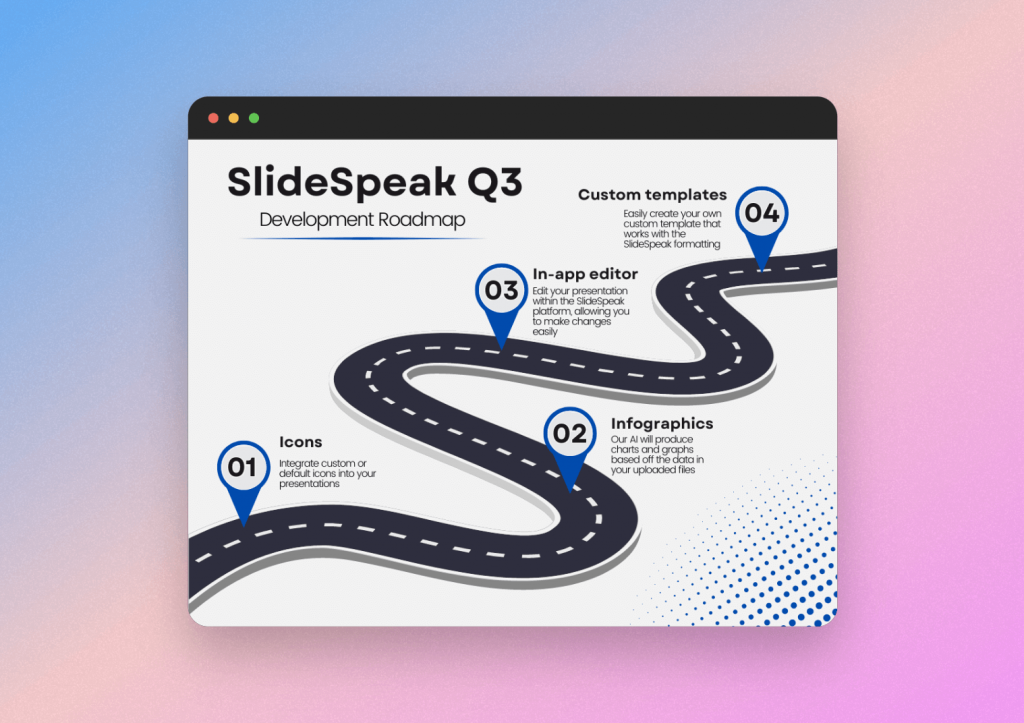
Below you can see our feature roadmap for Q3!

How You Can Stay Updated
You can keep an eye out on your emails or you can join our feature waitlist here – SIGN UP
Joining this list will give you early access to any new features we launch.