About this design
Where the Telemetry style comes from, and what it signals.
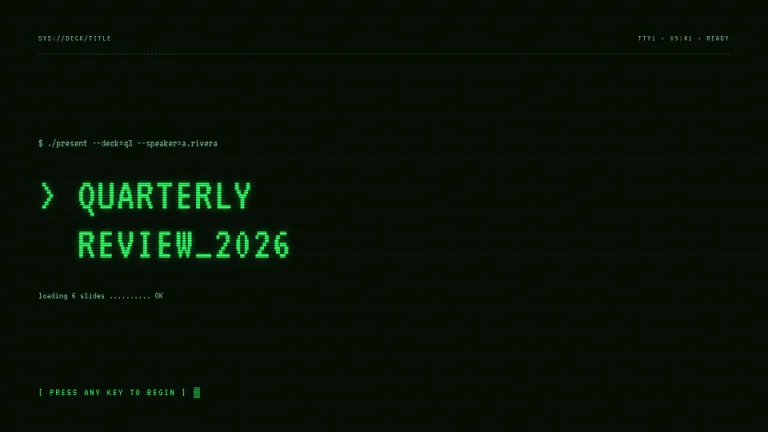
Telemetry is a presentation theme that looks like the dashboard your on-call engineer has open at 3 am. It borrows the panel-and-sparkline vocabulary of Datadog, Grafana and similar observability tools: dark background, monospaced metrics, status dots and SVG polylines. If you run your infrastructure this way, your slide deck can match.
Every content panel sits on #161B22 with a 1px #30363D border and 8px corner radius. IBM Plex Sans handles headlines at up to 64px bold in near-white #E6EDF3; IBM Plex Mono takes all numbers and labels, with 10px uppercase tracking at 0.25em to 0.3em for the label legibility that matters at glance speed. Neon teal #2DD4BF signals healthy data and live sparklines; violet #8B5CF6 handles the gauge arc and forecast series. The 8px teal status dot appears in the header row of every slide, confirming the system is up.
Telemetry suits infrastructure and platform teams presenting to audiences who read dashboards for a living: incident reviews, SRE briefings, Series A decks for developer-tool companies, and any talk where a live metric card earns more trust than a polished infographic.
Use it for
- Infrastructure and SRE team incident reviews
- Series A or B pitches for developer tools and observability products
- Platform engineering roadmap briefings
- Technical deep dives for engineering-led audiences
Skip it for
- Customer-facing sales decks where the dark terminal look may feel uninviting
- Print or handout formats, where dark panels consume significant toner
The presentation design prompt
This is the exact text that gets sent to your AI.
Create a presentation in the 'Telemetry' theme: a dark observability dashboard. Background: #0D1117. Content sits in panels of #161B22 with 1px #30363D borders and 8px corner radius. Accents: neon teal #2DD4BF for healthy data, sparklines and status, violet #8B5CF6 for the gauge and forecast series. Typography: 'IBM Plex Sans' with 'IBM Plex Mono' for data, both Google Fonts. Every number is 'IBM Plex Mono' in #E6EDF3, 18 to 42px inside panels. Labels are tiny 10px uppercase #8B949E, letter-spaced 0.25em to 0.3em. Four motifs: SVG polyline sparklines in teal, 2px stroke, inside panels; one gauge arc, an SVG circle with violet stroke-dasharray showing a percentage with a mono value centered; small 8px teal status dots with a soft glow meaning healthy; thin horizontal baseline grid lines inside charts at 10 percent white. Headlines 34 to 64px bold 'IBM Plex Sans' in #E6EDF3. A header row on each slide carries 'IBM Plex Mono' metadata and a status dot. Strictly avoid: light backgrounds; serif type; corner radii above 8px; red or warning colors; gradients on panels; decorative illustrations.

Use this theme for my slides. Ask me what the presentation is about first, then apply the theme to every slide.
View this prompt and its data on GitHub
How to use this prompt
From copied text to a finished Telemetry deck in four moves.
- 01
Copy the prompt
Use the copy button, or open it pre-filled in Claude or ChatGPT with one click from the panel on this page.
- 02
Tell the AI your topic
The prompt instructs the AI to ask what your presentation is about first. A sentence or a pasted outline is enough.
- 03
Generate and iterate
Ask for more slides or swap a layout. The avoid list at the end of the prompt keeps Telemetry on-style while the content changes.
- 04
Or skip straight to a deck
SlideSpeak turns your topic or document into a finished Telemetry presentation, exportable as PowerPoint or PDF.
Common questions
Working with the Telemetry presentation design prompt in practice.