The Top 5 Tools to Create Infographics with AI
Infographics are a vital part of any marketing material like PowerPoint presentations, newsletters or a sales brochure. They can serve as a sweetener for to visualize and convey and to give customers information in an easy and digestible format. Often times it’s extremely time consuming to create infographics, so we decided to look if you can create infographic with AI. Because wouldn’t that be a huge time saver?
Let’s say you don’t have expert design skills? Don’t worry; you can still create great infographics quickly and within your budget, thanks to the user-friendly AI-powered tools we looked at.
AI has revolutionized the creation of text based material like essays, emails and blog posts, but it’s starting to get more and more applications. You can now also create interactive marketing assets, from graphics and to entire website designs. This transformation includes using prompts and generative AI to create beautiful, effective marketing content like infographics.
In fact, AI has become so advanced in making these infographics that we’re now seeing features in modern platforms like:
- AI-powered design suggestions
- Smart data visualization
- Data-driven design suggestions
- Content optimization
- Theme matching
And more. Nearly anyone can take advantage of AI to streamline the creation of infographics.
This blog post is part of a series where we look at more specific use cases around presentations AI. Want to redesign your presentation with AI, checkout this post: https://slidespeak.co/blog/2024/09/20/5-ways-to-redesign-your-powerpoint-presentation/.
This post will discuss the top 5 AI-powered tools to create infographics and how you can use your prompting genius to get the most out of them.
What Makes a Powerful Infographic?
Infographics are powerful tools for explaining complex information. There’s various inforgraphic types suited for different content and goals.
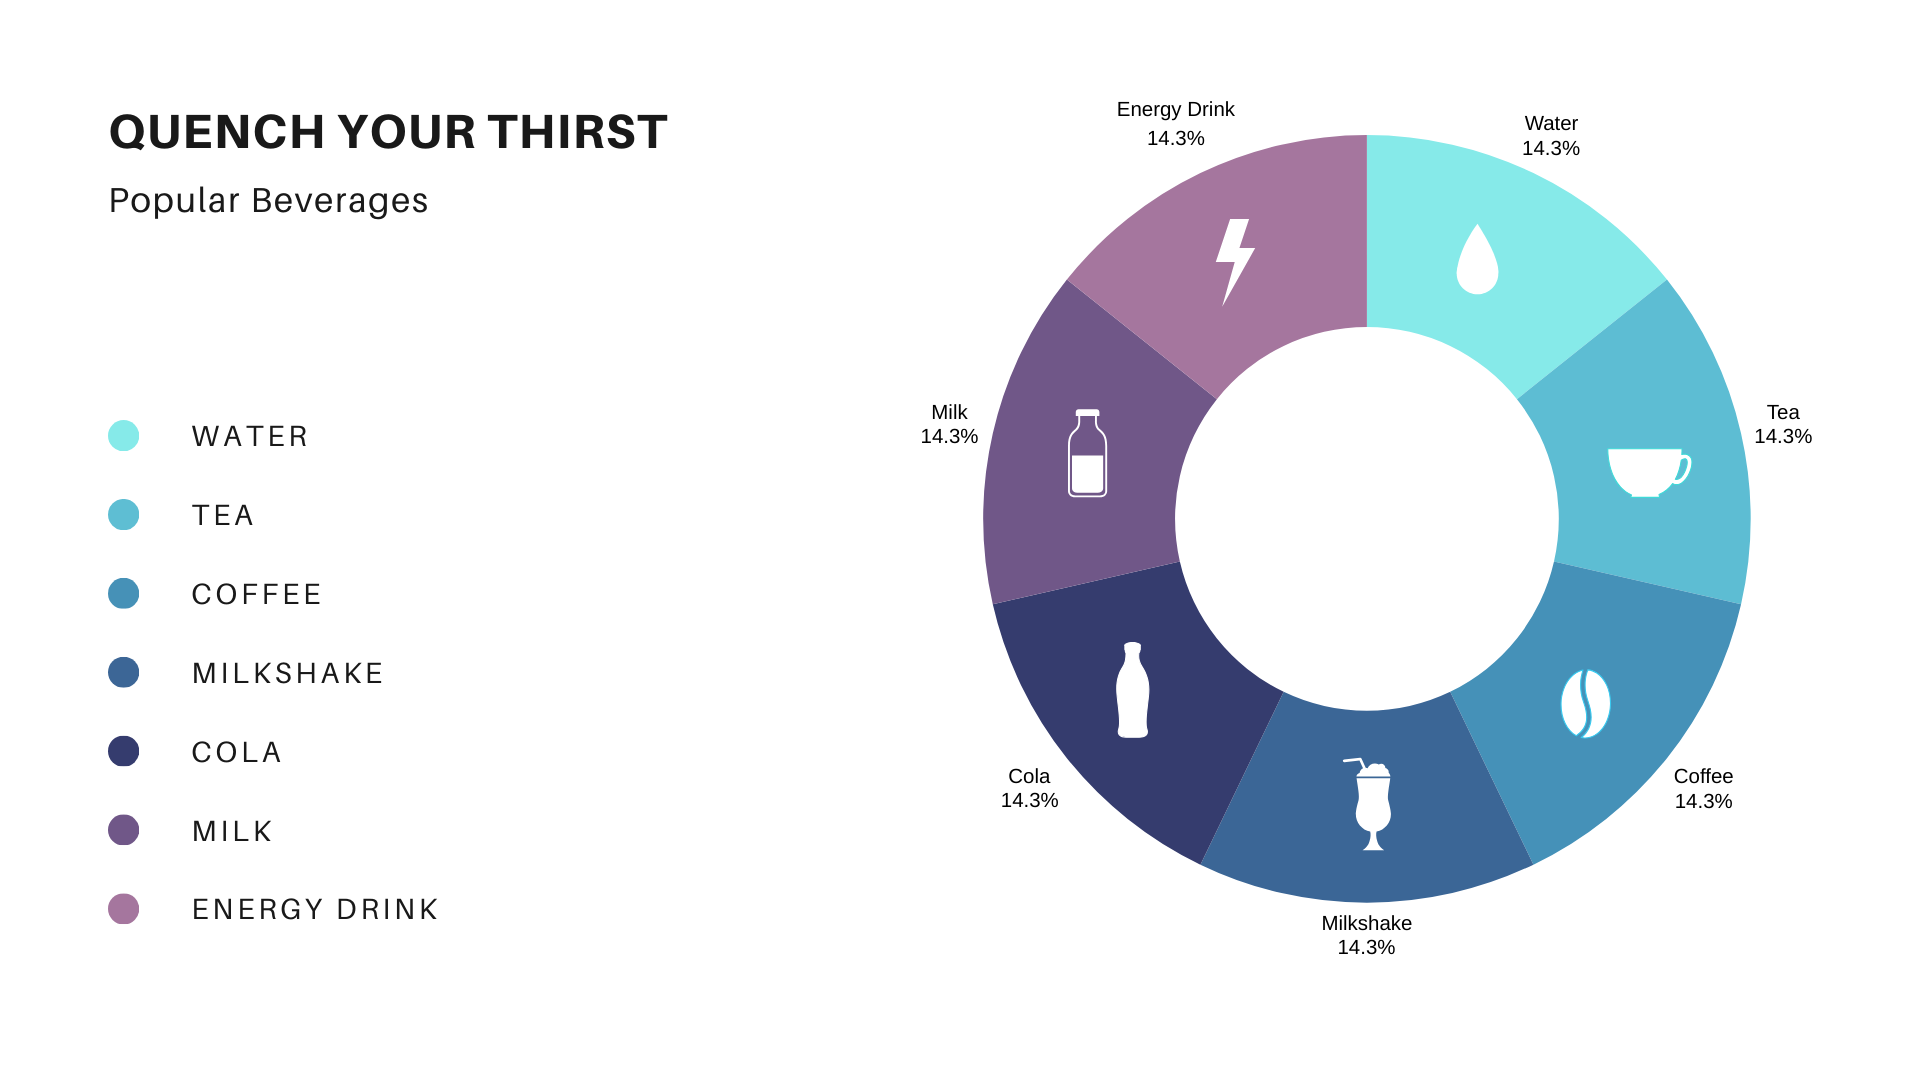
- Statistical infographics are ideal for presenting data-heavy information, such as survey results or key performance metrics. Using charts, graphs, and percentages makes it easier for readers to understand complex numbers.
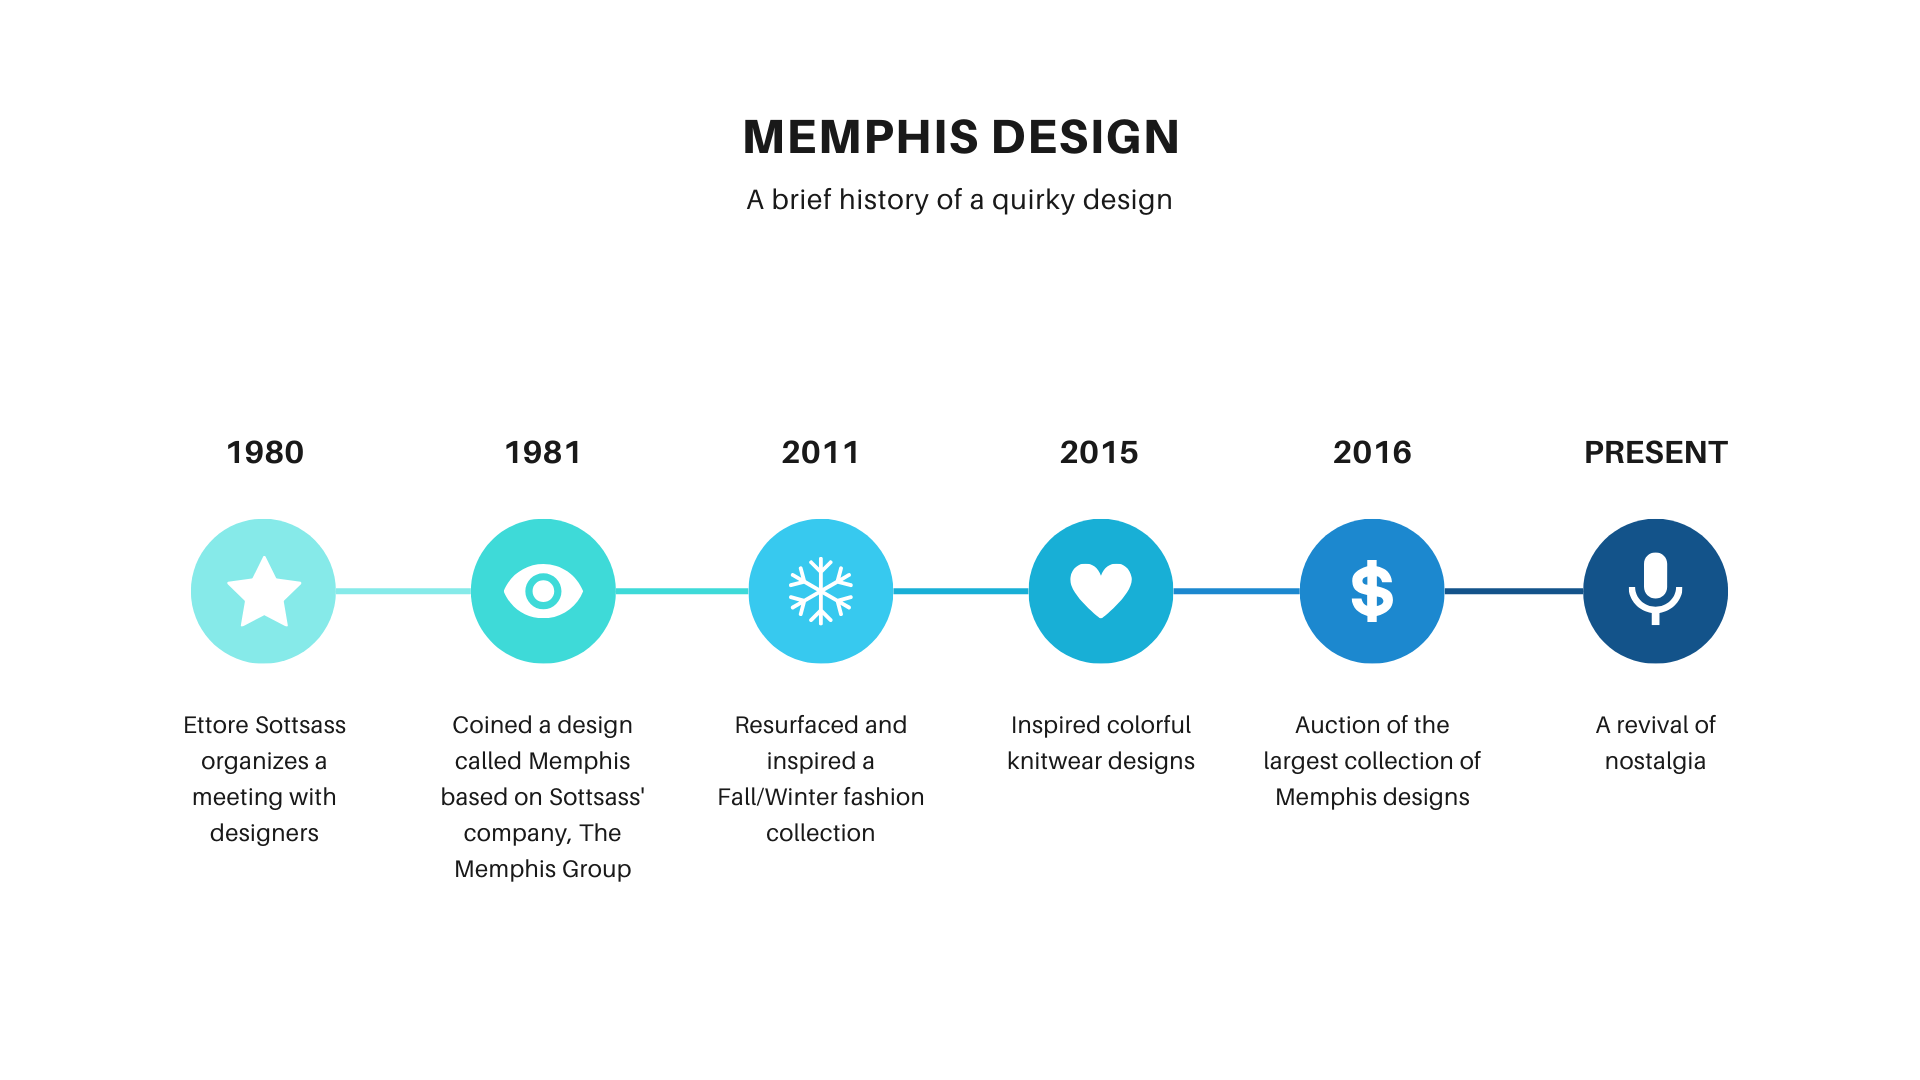
- Timeline infographics are a great choice for showcasing events or milestones. They highlight the chronological progression of events, making them perfect for telling stories like company history or product evolution.
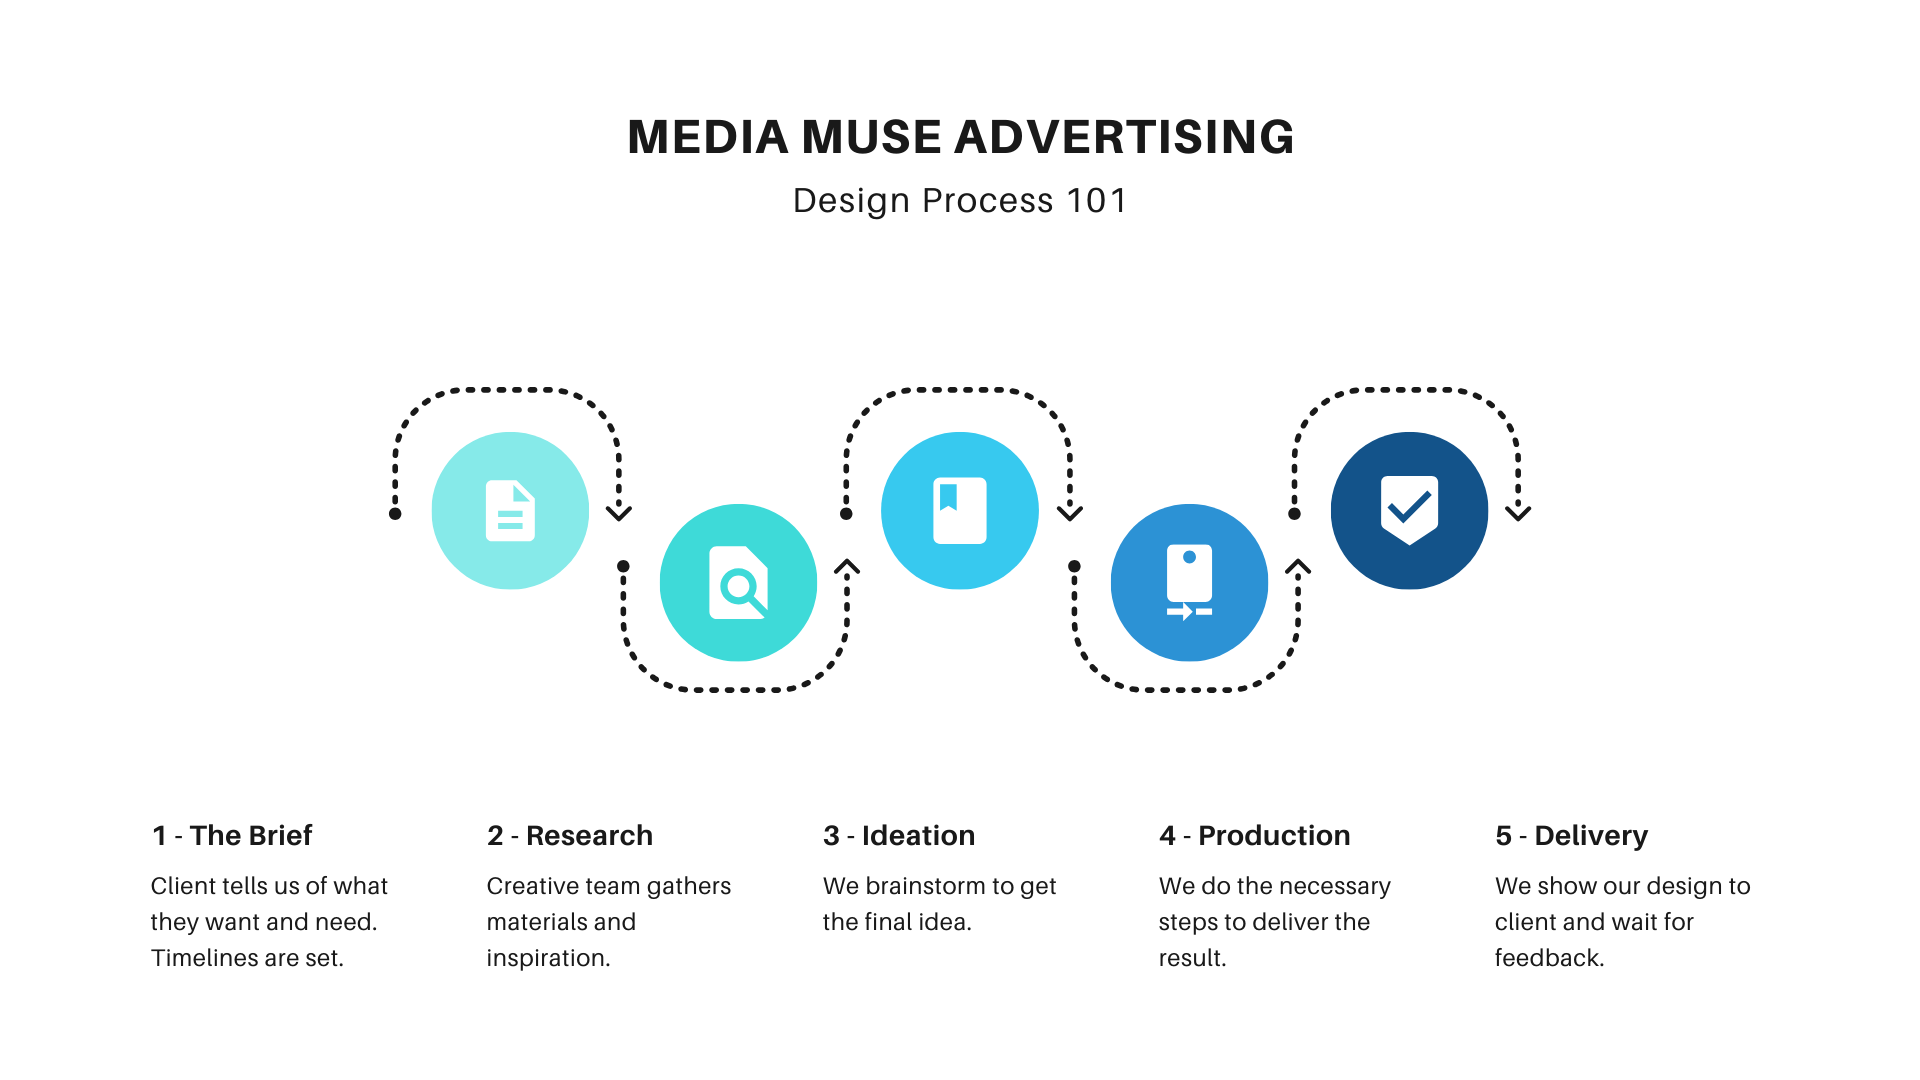
- Process infographics are highly effective when explaining step-by-step instructions or workflows. They break down complex processes into simpler steps, reducing the reader’s cognitive load.
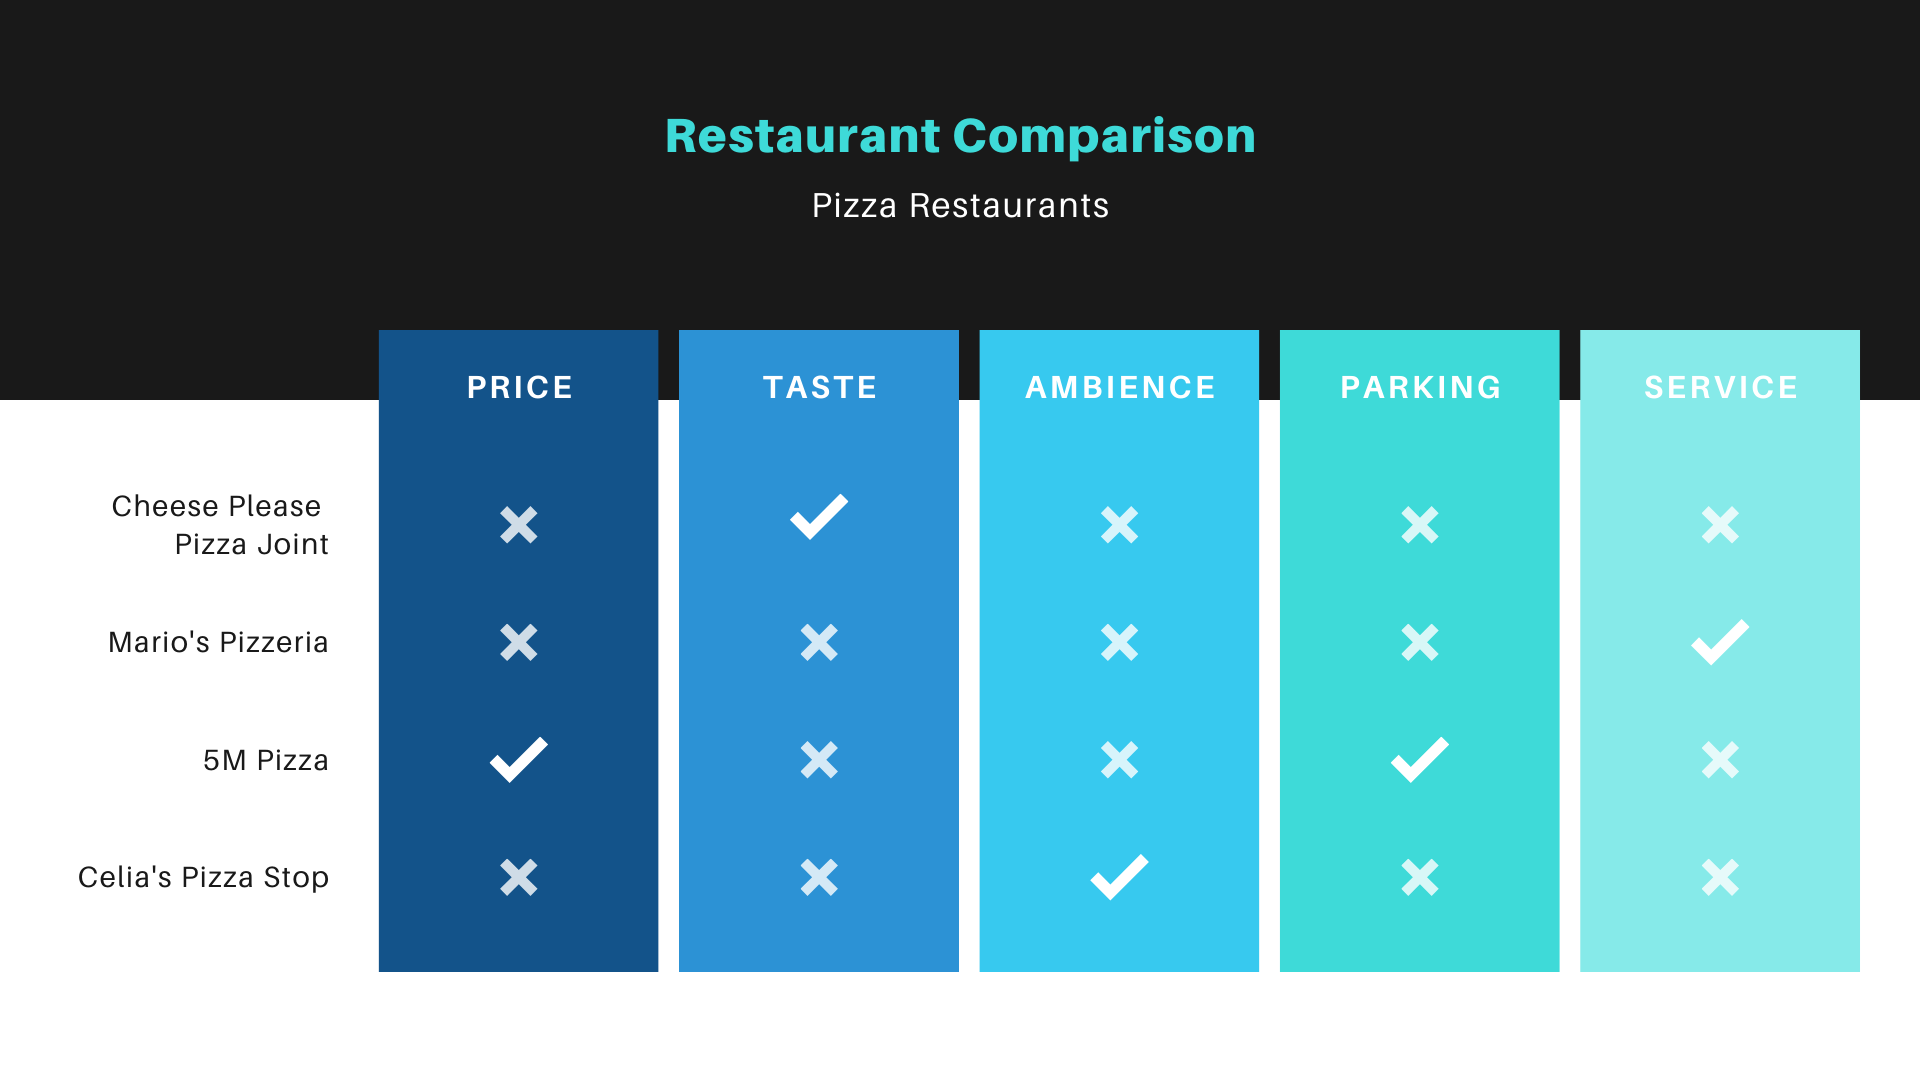
- Comparison infographics highlight similarities, differences, or advantages, making it easier to make informed decisions by visually contrasting key features or data points.
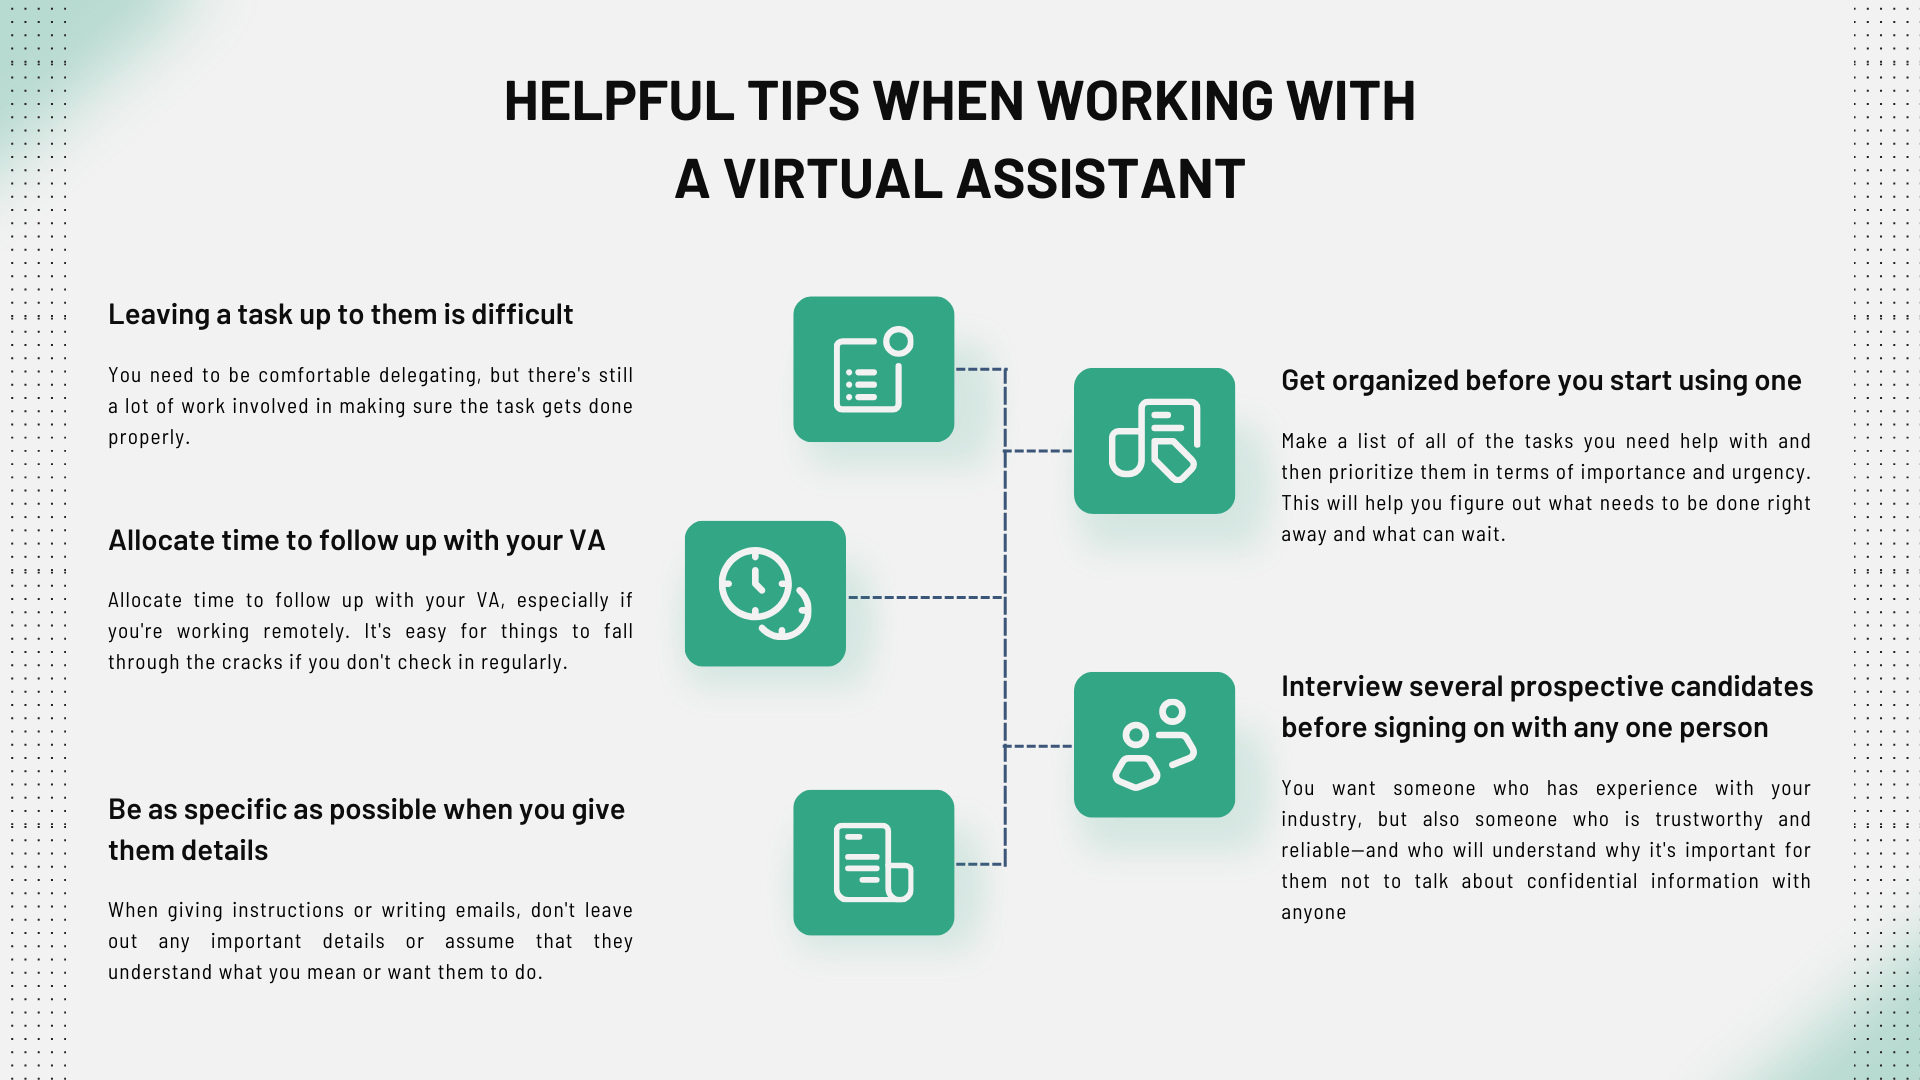
- List infographics summarize related items in a visually appealing format, making long lists more digestible and organized. They are great for top-ten lists, tips, or tool recommendations.
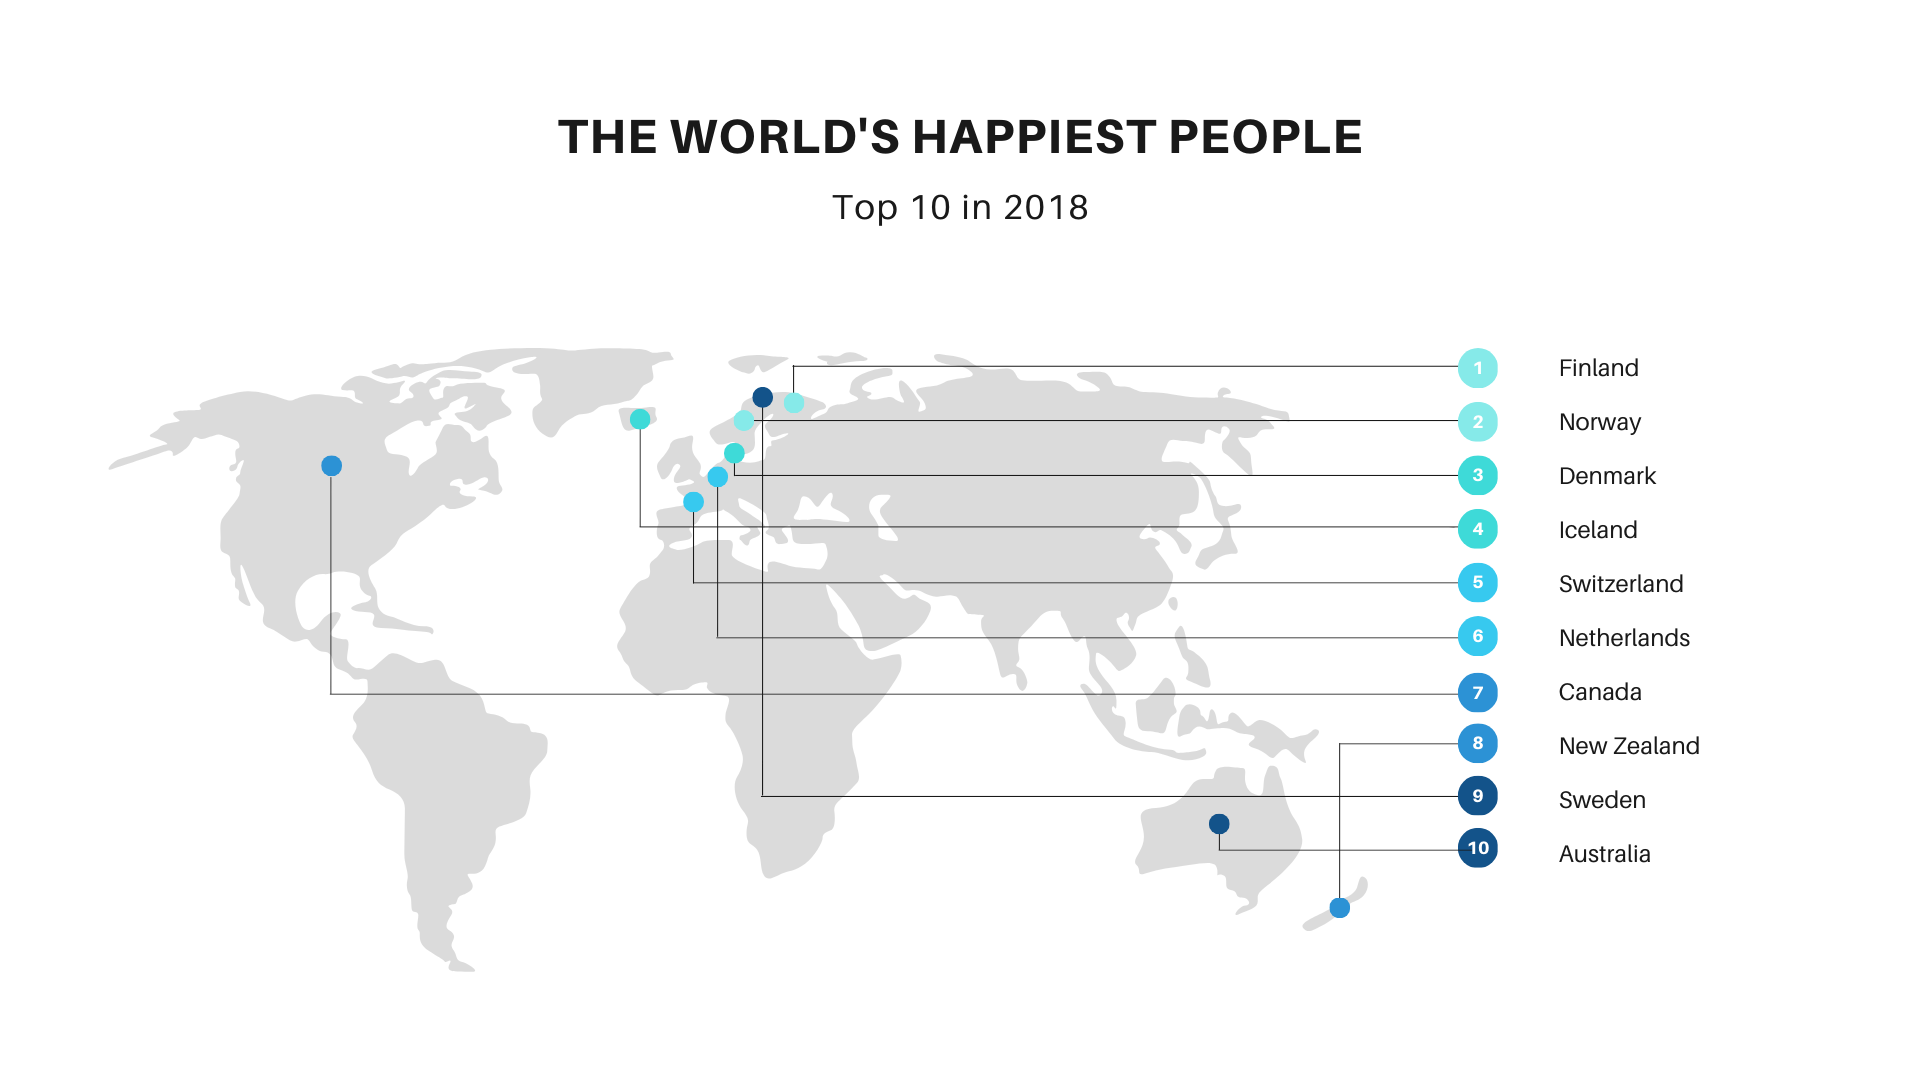
- Map infographics excel at visualizing data across regions, providing clear geographic context, which is particularly useful for market reach or regional trends.
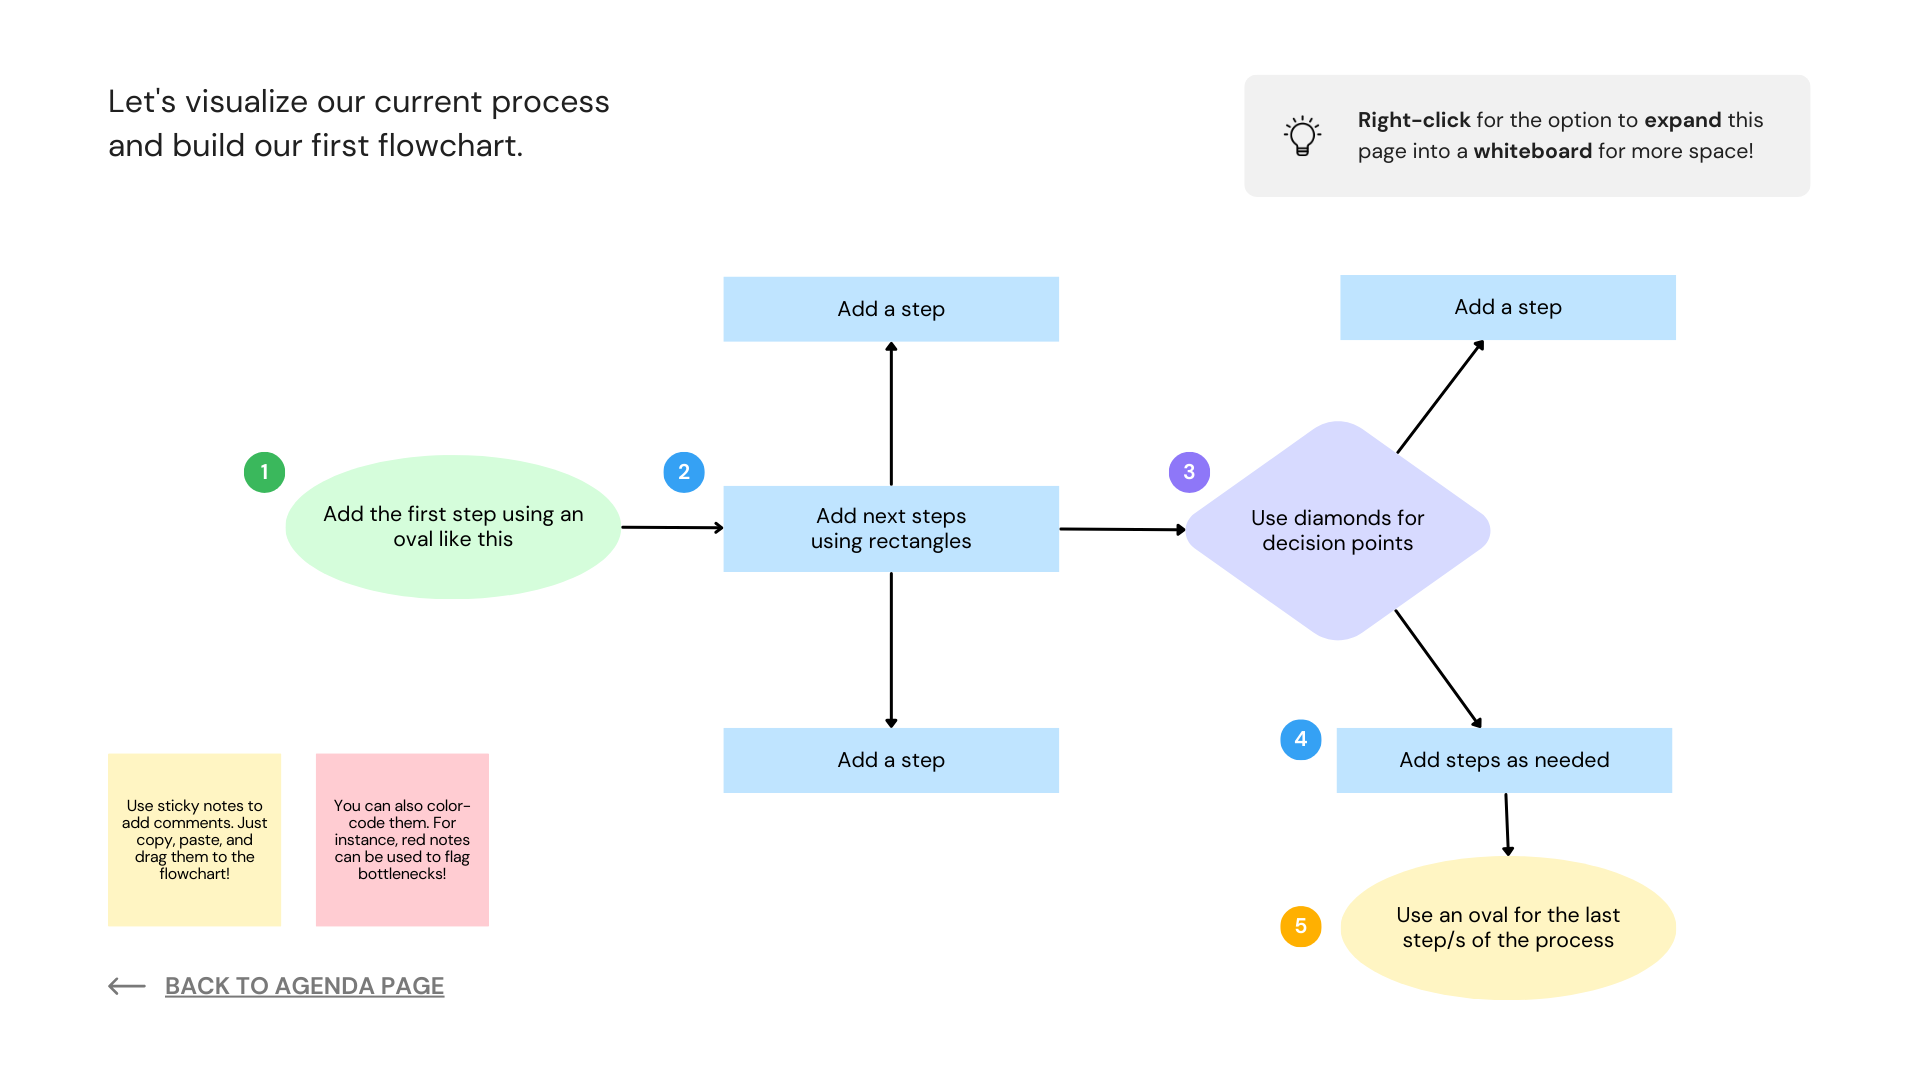
- Flowchart infographics are perfect for explaining decision-making processes or dependencies. They make complex pathways or options easy to follow by showing clear outcomes.
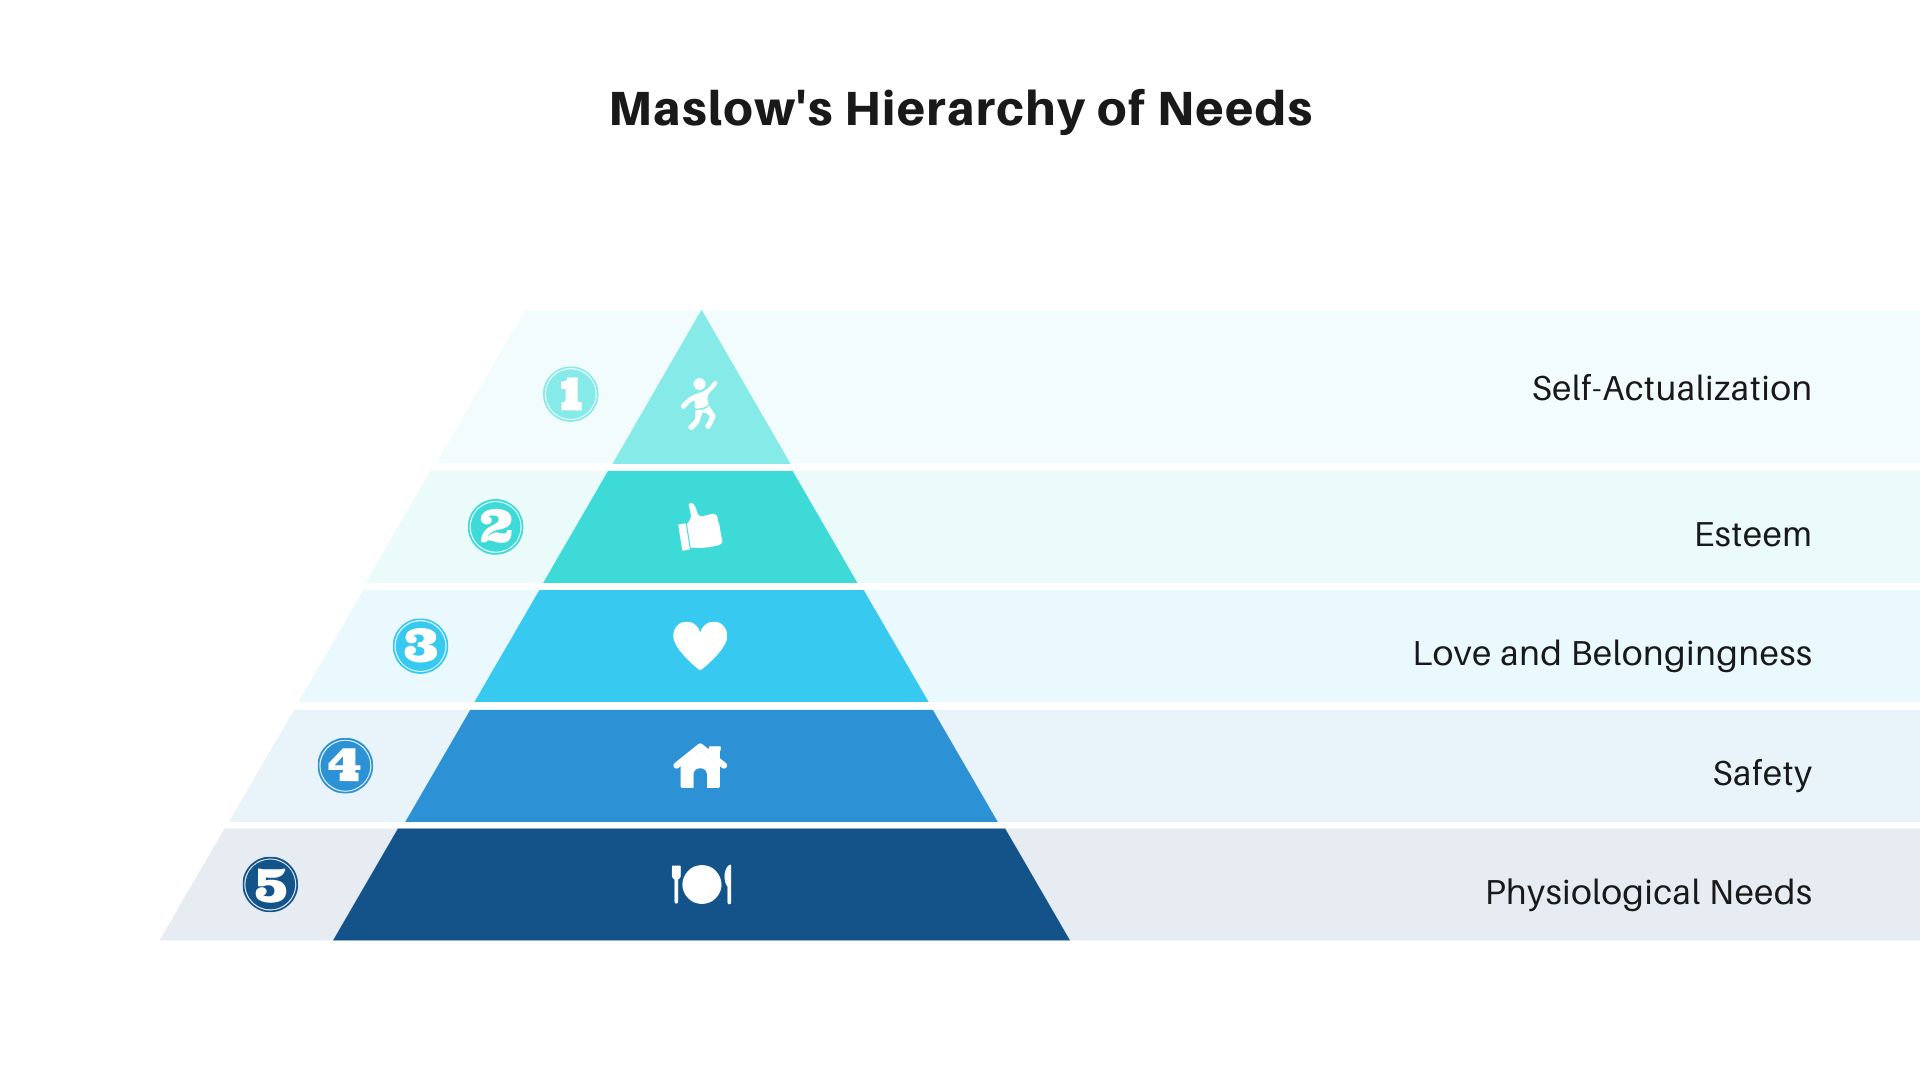
- Hierarchical infographics display structures or rankings clearly and organized, such as organizational charts or ranking systems, helping readers easily understand relationships or priorities.
- Interactive infographics are highly effective for engaging audiences more dynamically. They allow users to click or explore different data sets or customize their experience. These work well for data exploration tools or product selectors.
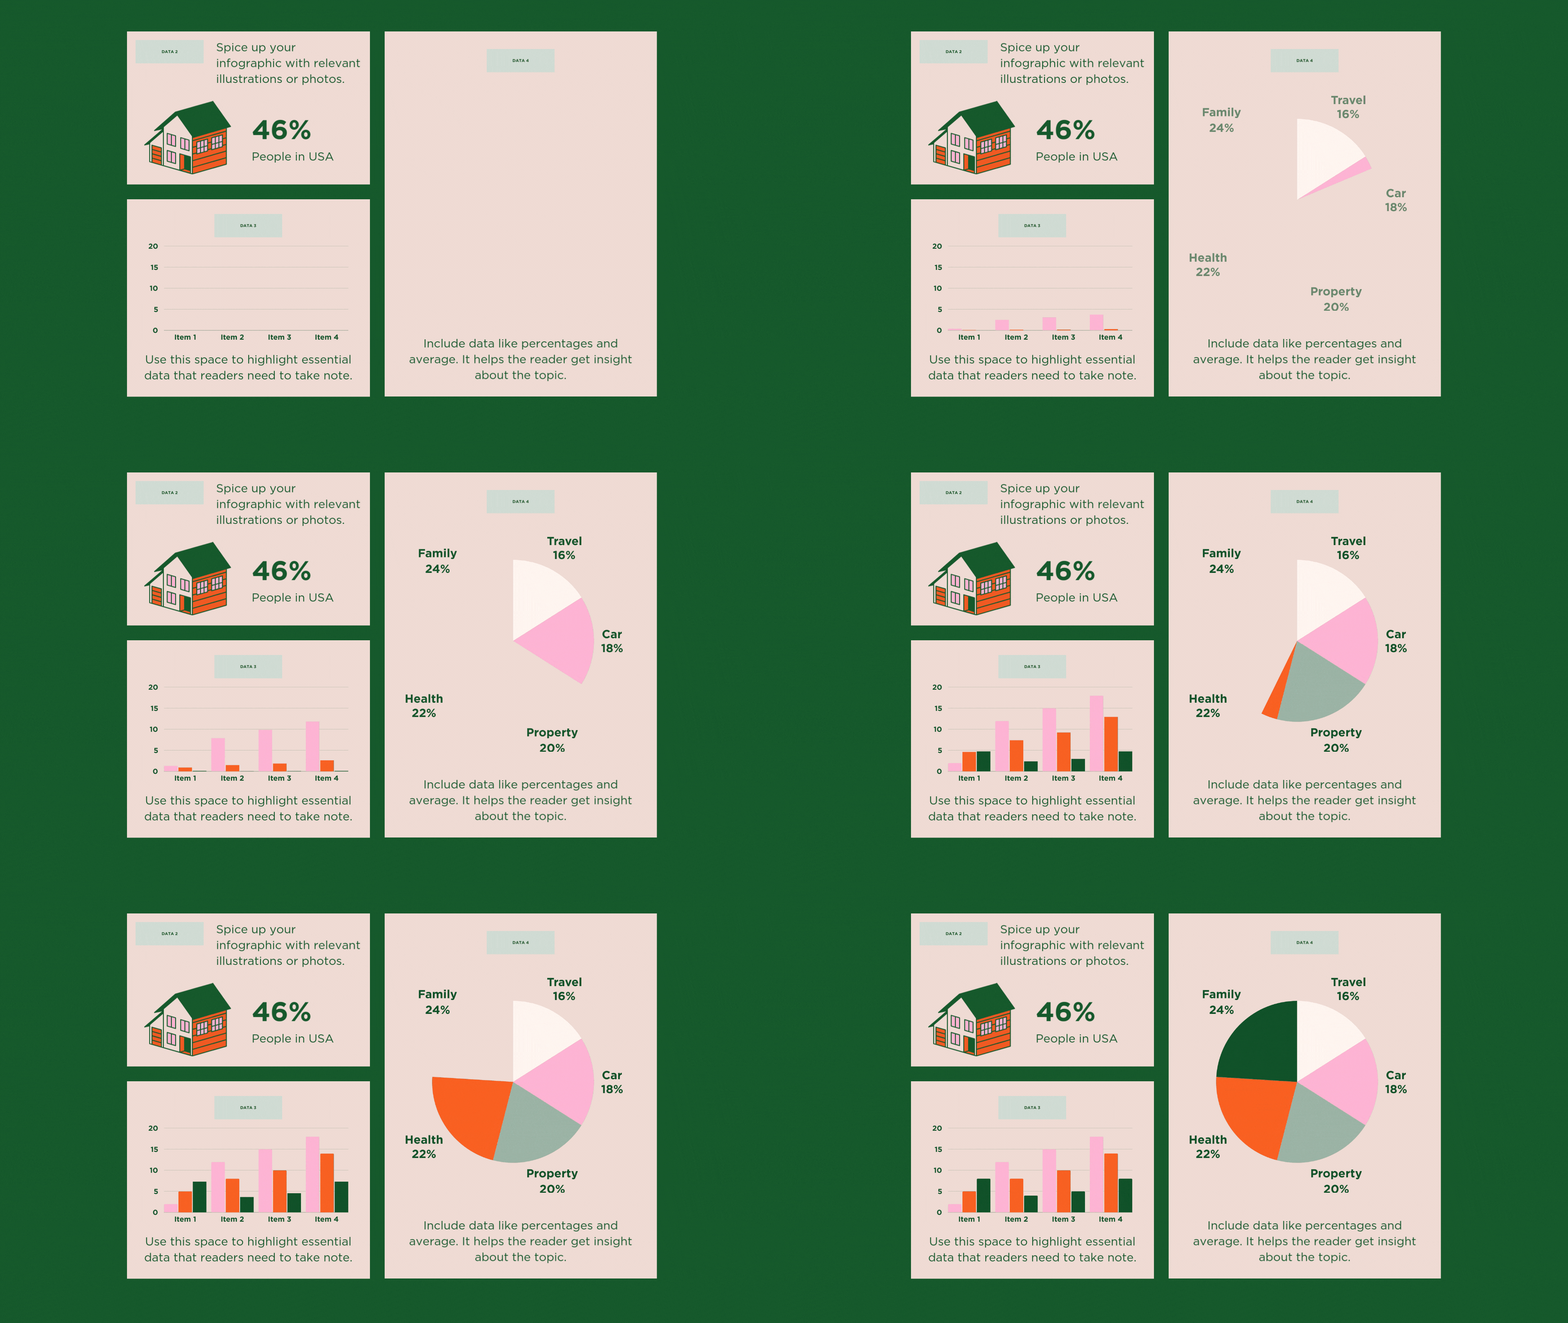
Each infographic type can be customized based on your goals and the specific information you want to communicate, making them versatile tools in any content strategy.
The 5 tools to create infographics with AI:
- Piktochart
- Venngage
- Infogram
- Canva
- Whimsical
Piktochart – Create Infographics with AI
Piktochart and Piktochart AI in particular is a specialized infographic maker tool designed to focus on data visualization. Its intuitive user interface and powerful AI-driven features simplify the design process, making it accessible to users with varying design expertise–a critical feature for these solutions. Accordingly, Piktochart is widely used in educational, business, and non-profit sectors to create infographics, reports, and presentations. It’s currently the most popular tool to create infographics with AI.
Pricing
- Free Plan: This plan provides access to basic features, limited templates, and the ability to create simple infographics, though downloads are watermarked.
- Pro Plan: $14/month. This plan offers an expanded selection of templates, high-resolution downloads, and branding options suitable for professionals who require more advanced design capabilities.
- Business Plan: $24/month per user, including all Pro features, enhanced collaboration tools, advanced branding, and analytics. This plan is ideal for teams working on projects together.
- Enterprise Plan: This pricing tier only comes via a quote but includes everything from every other tier plus customized templates and direct support from the company via a dedicated customer contact.
Benefits of Piktochart
- Data-Driven Design: Piktochart’s data visualization features make complex data easy to understand, allowing users to create charts, graphs, and maps seamlessly.
- Customizable Templates: Offers a wide range of professionally designed templates that cater to various industries and use cases, which can be tailored to meet specific design requirements.
- AI Assistance in Design: The tool’s AI provides suggestions on the best ways to present data, including which chart types to use, how to structure the infographic, and layout optimization, ensuring that your infographic is informative and visually appealing.
- Branding Options: Piktochart’s Business and Enterprise plans offer extensive branding options, allowing users to maintain consistent branding across all their visual content.
- Collaborative Features: Most plans include collaboration tools that enable multiple users to work on an infographic simultaneously, facilitating teamwork and improving efficiency.
How to Use Prompts to Create an Infographic in Piktochart
Piktochart makes it easy to go from prompt to editable infographic within minutes.
Once you’ve logged in, find the Piktochart AI menu item on the left-hand side and click it:
This will take you to a prompt screen. Here, you can enter prompts to define the infographic’s topic (note that free accounts only start with 50 credits to create these infographics). Regardless that will be more than enough to create an infographic with AI for our purposes.
In this example, we asked the AI to create an infographic on the history of professional basketball in the 1980s:
Click on the Generation Infographics button. This triggers the tool to create an infographic with AI.
You will get a list of templates pre-populated with content based on your prompt. These templates will change each time, so you can search through them for unique color schemes and layouts as you need.
Also note that while the content will follow your AI prompt, only some images will align with that topic. That’s OK, however, because once you select your template, you’ll be taken directly to an editing screen:
Here, you can make adjustments, add or replace images, refine your text, or add additional material.
Are you ready to take your presentations to the next level using AI and professional templates? Try a free demo of SlideSpeak today.
Venngage
Venngage is a robust tool for creating infographics, particularly well-suited for business, marketing, and education professionals. It offers a user-friendly interface combined with powerful design capabilities.
Venngage is a design company first, so you’re getting infographic templates and design tools with any plan. The AI features can help you start with a great topic and format to import into the design studio.
Pricing
- Free Plan: Limited access to basic templates and design tools, with watermarked downloads.
- Premium Plan: $10/month. This plan offers access to a broader range of templates, additional design tools, unlimited designs, and enhanced export options, suitable for individuals needing more advanced features.
- Business Plan: $24/month per user, providing comprehensive access to all features, including advanced analytics, exporting unlimited templates to PDF and PowerPoint, priority customer support, premium design assets, and team collaboration tools, ideal for businesses and agencies.
- Enterprise Plan: This includes everything in the Business Plan, API access, extensive customer support, multi-factor authentication, and a dedicated account manager.
Benefits
- Business and Marketing Focus: Venngage offers templates specifically designed for business, marketing, and professional presentations, ensuring users can create infographics that meet industry needs.
- AI-Powered Design Enhancements: Venngage’s AI suggests layout improvements, color adjustments, and font choices to enhance your infographic’s aesthetic and functional aspects.
- Extensive Customization: Users can deeply customize templates, changing everything from colors to fonts and adding unique design elements, allowing for highly personalized infographics.
- Team Collaboration: The Business and Enterprise plans enable multiple users to collaborate in real time, making it easy for teams to collaborate on infographic projects.
- Professional Export Options: Venngage provides various export options, including high-resolution images and PDFs, ensuring that your infographic can be used in multiple professional contexts.
Venngage also includes special pricing for teachers and educators.
How to Create Infographics with AI in Venngage
Venngage’s AI, Muse, is a free tool for creating and refining infographic designs within the Venngage editor.
To begin, visit the Venngage Muse webpage and click the Generate a Design button. Then, enter a prompt in the input bar and click the Generate with AI button. In this example, we prompted Muse to “Tell us the history of AI with a professional and simple infographic”:
You’ll be taken to an image preview of your new infographic. If you aren’t happy with the design, you can re-enter the prompt and click the Generate with AI button again to get a new design:
If you are happy with the design, however, you can hover your mouse over the preview image and click the Customize Design button:
You will then be taken to an editing dashboard where you can change design elements, text blocks, and colors.
Infogram
Infogram is a specialized data visualization and infographic creation tool to help users create stunning, data-driven visual content. It is particularly well-known for its ease of use in creating interactive infographics, charts, and reports. Infogram combines a user-friendly interface with powerful data visualization capabilities, making it an ideal choice for businesses, educators, and organizations to generate or create infographics with AI.
Infogram’s AI features help users design infographics that look professional and effectively communicate complex data insights. The platform is handy for users who must create infographics incorporating real-time data, interactive elements, and multimedia content.
Pricing
- Free Plan: This plan is free, but it offers limited access to templates, a restricted number of projects, and a limited infographic length. It is suitable for individuals or small projects with basic needs.
- Pro Plan: $19/month, offering additional templates, premium design assets, and the ability to create more complex infographics without watermarks, ideal for professionals. Includes many more images and optimization options, including advanced image editing.
- Business Plan: $67/month, providing enhanced features, including advanced analytics, team collaboration tools, and custom branding options, perfect for small to medium-sized businesses. It will include presenter notes, database connections, and unlimited project sizes.
- Team Plan: $149/mo, includes everything in Business plus advanced collaboration features like commenting and analytics. It starts at three users per license.
- Enterprise Plan: Custom pricing tailored to large organizations with extensive needs for data integration, security, and team collaboration features. This plan includes dedicated customer support, additional security measures, custom templates, and development options.
Benefits
- Advanced Data Visualization Tools: Infogram excels in data visualization, offering a wide array of charts, graphs, and maps that can be easily integrated into infographics, making complex data more understandable.
- Interactive Infographics: Users can create interactive infographics that include clickable elements, embedded videos, and real-time data feeds, enhancing engagement and user experience.
- AI-Powered Design Suggestions: Infogram’s AI recommends chart types, color schemes, and layout optimizations based on visualized data, ensuring the infographic is informative and visually compelling.
- Real-Time Collaboration: The Business and Enterprise plans include collaboration features that allow multiple users to work on an infographic simultaneously, facilitating teamwork and productivity.
- Custom Branding and White-Labeling: Infogram allows businesses to maintain brand consistency across all infographics by offering custom branding options, including white-labeling, for a more personalized experience.
Building an Infographic in Infogram with AI
Once you’ve logged in, you’ll land on the primary dashboard. Click on the Create with AI icon:
You’ll immediately be taken to an AI studio dashboard. You’ll see a prompt entry box on the left-hand side of that dash. Enter your prompt here and click the Generate content button:
Then, select one of the pre-made templates from the right-hand side of the dash:
Finally, click on the Open in editor button:
You’ll be taken to a design studio interface where you can edit images, add text, and move elements throughout the infographic.
Canva
Canva is a design platform that allows users to create a wide variety of visual content, including infographics. Whether you want to create detailed visual charts of data or more creative infographics, Canva offers a lot of templates and design elements to choose from.
The platform allows users to either create infographics with AI or manually. You can even use their AI-powered direct ChatGPT integration to speed up your work.
You can also create infographics without AI with Canva. For instance you can simply navigate to Canva’s “Infographics” section, select from a variety of templates like timelines, statistical graphs, or comparison charts, and customize these templates by adding their data and adjusting visual elements.
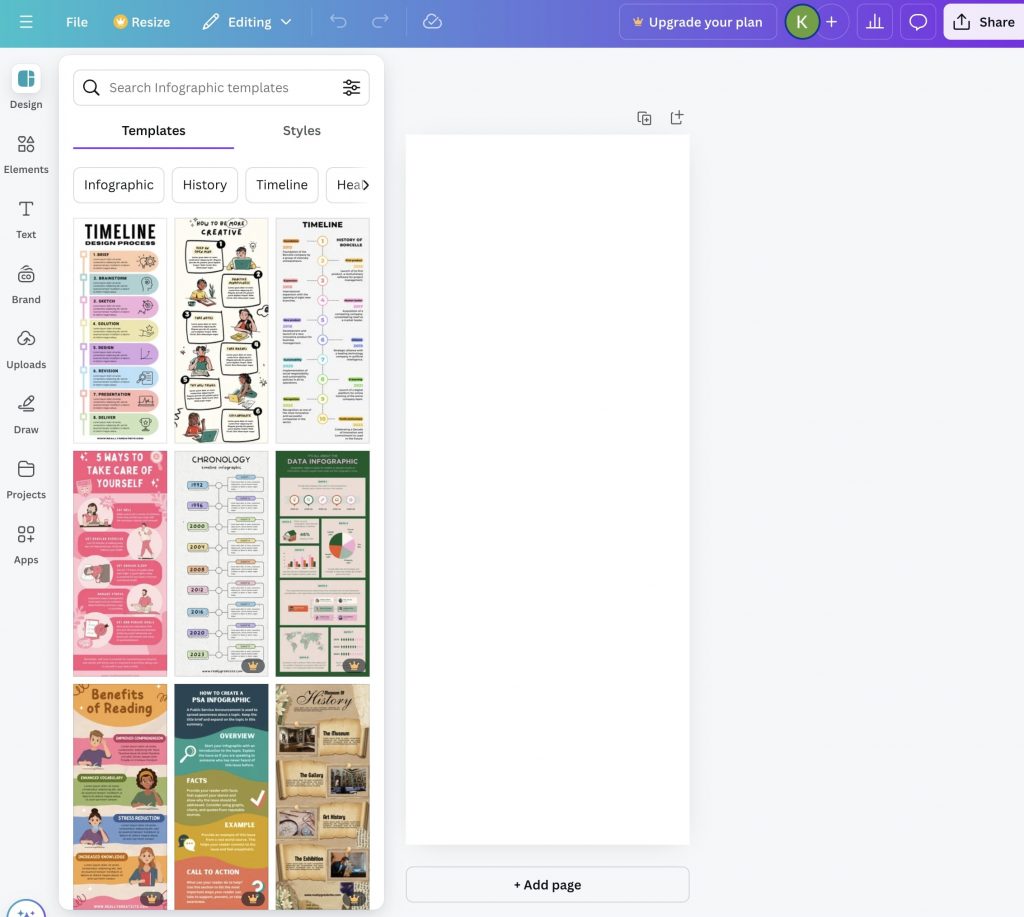
Canvas interface is intuitive, and the templates are made for users of all skill levels.
Additionally, Canva has a GPT-powered feature within ChatGPT that makes it easy to create infographics. You can read here how the GPT directly made by Canva works within ChatGPT: https://www.canva.com/help/chatgpt-templates/
Once you’re in ChatGPT and you have the Canva GPT open you can simply input a prompt, such as:
“Create an infographic for EU GDP Growth from 2010 to 2020”
Canva and ChatGPT AI generates a relevant template
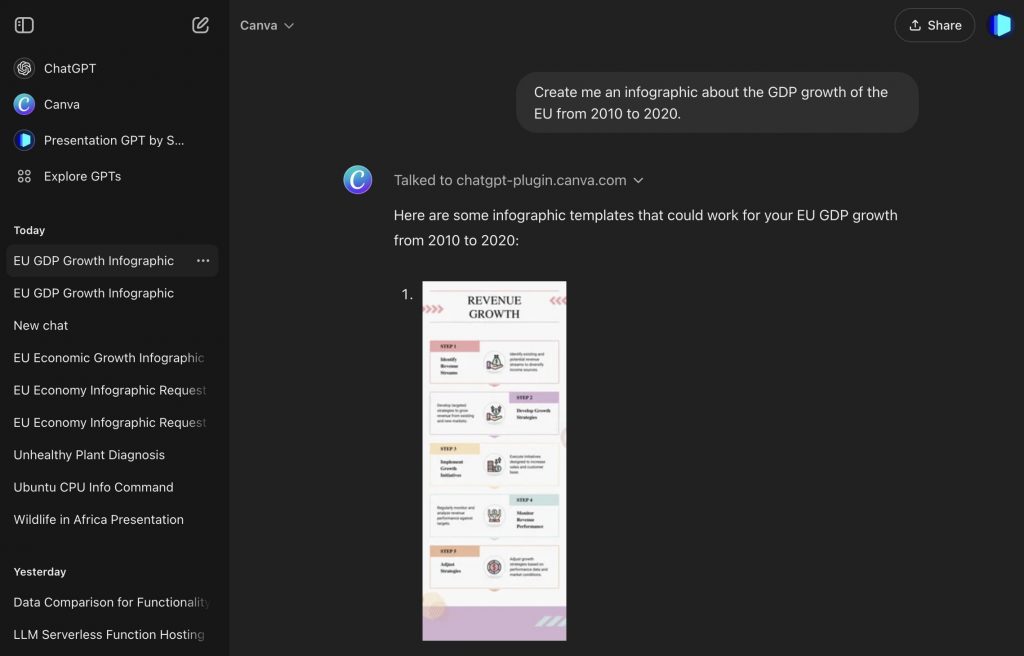
You can then further refine the infographic using Canva’s editor. Simply make adjustments to text, layout, and graphical elements to align with the specific needs of your presentation.
Pricing
- Free Plan: Provides access to basic templates and design tools, but with watermarked downloads. Ideal for small projects or personal use. The free plan is enough for basic infographics.
- Pro Plan: $12.95/month. Offers access to a broader range of premium templates, additional features such as exporting without watermarks, and team collaboration tools.
- Enterprise Plan: Custom pricing, with full branding options, dedicated customer support, and advanced collaboration tools. Suitable for larger organizations or teams.
Benefits of Canva
- Extensive Template Library: Canva provides a wide array of infographic templates tailored to different needs, from business presentations to educational visuals.
- Ease of Use: Its drag-and-drop interface makes it accessible even to users without design expertise.
- AI-Driven Design Suggestions: The platform’s AI feature helps generate design suggestions based on prompts, speeding up the creative process.
- Custom Branding Options: Canva allows users to upload logos and maintain brand consistency across all their designs.
- Team Collaboration: The Pro and Enterprise plans support real-time team collaboration, making it easy for multiple users to work on a design simultaneously.
Whimsical
Whimsical is a platform designed for creating simple and clear visual content, such as flowcharts, mind maps, and diagrams. The tool is especially useful for visualizing processes and ideas without needing complex design skills. Whimsical’s direct integration in ChatGPT allows users to quickly generate infographics based on specific prompts, offering an efficient way to represent data visually.
You can access the GPT in ChatGPT from Whimsical here: https://chatgpt.com/g/g-vI2kaiM9N-whimsical-diagrams
For instance, using Whimsical’s AI, we can create an infographic showcasing the “EU GDP Growth from 2010 to 2020” in the form of a sequential arrow chart. The design is quite basic but functional, presenting the data clearly without unnecessary visual clutter.
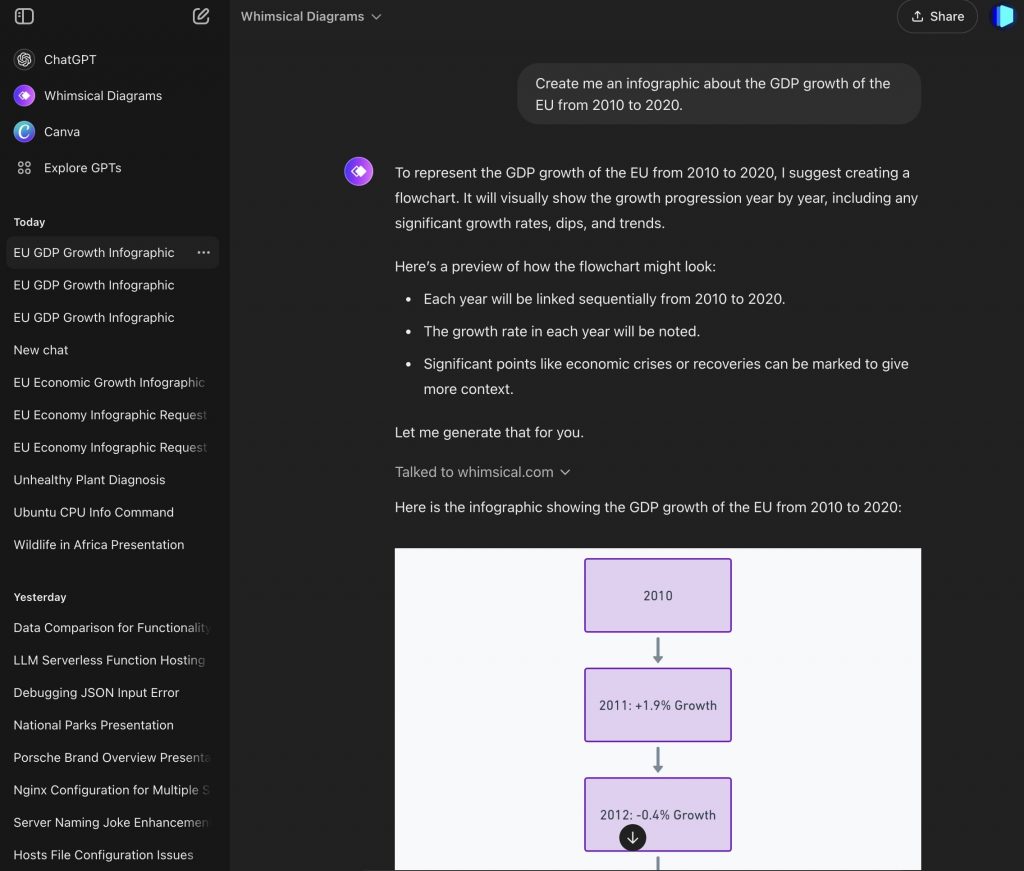
While Whimsical may not offer as many advanced design elements as Canva, it excels in simplicity, making it ideal for users who need to quickly produce straightforward, data-focused visuals.
Pricing
- Free Plan: Includes basic features and templates, but with limitations on the number of elements and the complexity of the designs.
- Pro Plan: $10/month. Offers enhanced templates and collaborative features suitable for team projects.
- Enterprise Plan: Custom pricing, with advanced collaboration and customization options for larger teams and organizations.
Benefits of Whimsical
- Simplicity and Speed: Whimsical’s focus on clean, minimalist design helps users create effective visuals quickly.
- AI-Powered Infographic Creation: The platform’s GPT feature allows users to generate infographics directly from prompts, speeding up the design process.
- Collaborative Features: Teams can collaborate on diagrams and charts in real-time, improving workflow efficiency.
- Data-Focused Designs: Whimsical prioritizes clarity in data presentation, making it an excellent choice for infographics like flowcharts and process diagrams.
Final Thoughts
AI can help you create infographics with AI faster and with ease. In this blog, we explored how tools like Canva, Whimsical, Piktochart, and Venngage allow you to create professional infographics without needing advanced design skills. These tools simplify the process, making it quicker to turn complex data into clear visuals.
AI is also becoming a key part of everyday office tools. Microsoft Copilot in PowerPoint can help you generate complete presentations. This also means AI can now creates slides, infographics, and visuals for you, allowing you to focus on the content instead of design.
You can expect other tools like Notion and Airtable to add AI features soon. They may let you create infographics directly from their platforms. Tools like Google Slides and PowerBI might also use AI to turn your data into charts and visuals automatically.
AI can improve your work, whether you’re an educator, marketer, or business professional. It allows you to create better presentations and reports in less time. By using AI-generated infographics with PowerPoint, you make your presentations more engaging and professional.
You can expect more tools to offer ways to create infographics with AI as the technology grows. AI will make it easier for anyone to turn data into clear, impactful visuals. The future of presentations and design is here, and it’s becoming more accessible.
Do you want an even more powerful AI to help you create professional documents like presentations? Try a free demo of SlideSpeak today.
